ECO-9492 · REV U · effective September 26, 2026
EV Manufacturing TransitionAPPROVEDEngineering notice
Interesting Engineering Rounds Up Seven Largest US EV Plants
Interesting Engineering's new survey ranks the seven largest US EV plants. We read it as a claims list of announced capacity, not verified output — here is how to parse it.
Scope of change
- Interesting Engineering published a survey ranking the seven largest EV manufacturing plants in the US.
- Rankings of plant size rest on OEM-announced capacity and investment figures, which are intentions rather than verified output.
- Watch production releases, OEM ramp schedules, and state incentive decisions for signs the ranking could change.
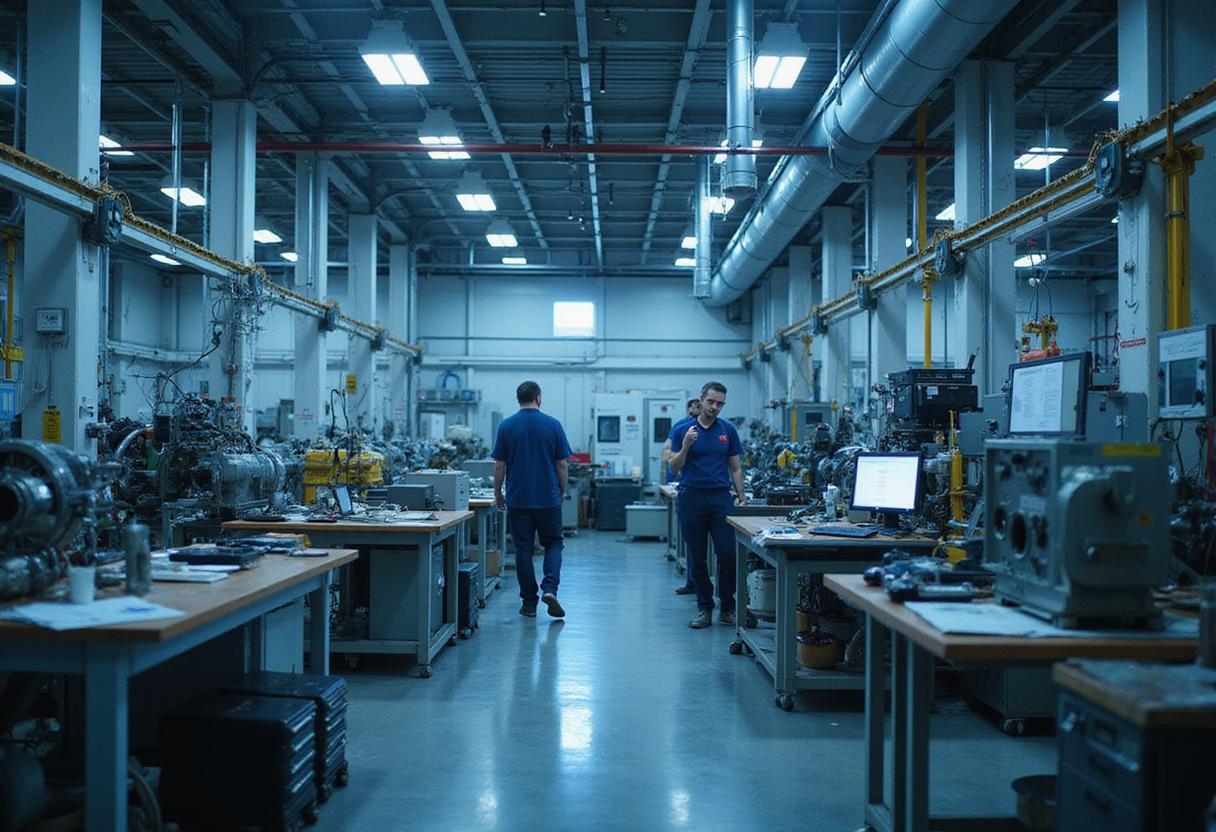
Interesting Engineering has published a survey headlined "7 of Largest EV manufacturing plants in the US," a roundup that organizes the country's biggest electric-vehicle production sites into a single ranking.
The headline number is the count itself: seven plants. That figure frames the entire piece. No single attribute — square footage, headline capacity, payroll, or investment — is spelled out in the survey's title, so readers approaching it as capacity data should adjust expectations before clicking.
For manufacturing planners, the more useful question is which facilities make such a list at all. Rankings of this kind typically draw from OEM announcements: stated design capacity, quoted program timing, and investment totals released at groundbreaking or launch events. Those are intentions, not verified throughput. Any plant appearing on a "largest" list earned the position through what its owner has said, and the owners have strong incentives to round up.
This is the core caution for anyone using roundup journalism as market intelligence. A plant's announced capacity — the number in the press release — and its demonstrated output — the number in the production data — are frequently different figures, sometimes by wide margins. Ramp curves in the EV sector have proven steeper and slower than most launch materials anticipated. Trade readers should therefore treat each entry in the Interesting Engineering survey as a claim to verify against registration data, supplier volume reports, and state incentive compliance filings, which often carry employment and output thresholds the plant must actually hit.
The seven-plant frame also tells a story about concentration. The US EV manufacturing base is not distributed across dozens of mid-sized sites. It clusters around a handful of large, capital-intensive facilities, most of them announced between 2020 and 2023, when OEMs committed unprecedented sums to electrification programs on aggressive timelines. A ranking that fits inside seven entries reflects that concentration. It also reflects the composition of the plants themselves: EV-dedicated lines are large-footprint operations, sized for battery pack integration, e-drive assembly, and the floor space that gigacasting and pack-to-structure manufacturing demand.
The location dimension matters as much as the size dimension. Every plant on a list like this anchors a regional supplier corridor — battery cell partners, stamping, seat and wiring harness tiers all sit within logistics range of the final assembly site. When a ranking names a plant, it implicitly names a supply basin. Procurement teams read these lists for that reason: the plant location predicts where tier-one and tier-two capacity will be built next.
There is also a timing story embedded in any current snapshot. The plants that dominate US EV output today were not all planned as EV-only sites. Some were converted from internal-combustion lines, and conversion plants carry different constraints — inherited floor plates, legacy paint shops, union agreements — than greenfield builds. A ranking that mixes the two types tells readers less than it appears to unless it separates them. Whether the Interesting Engineering survey makes that distinction is the first thing to check on reading the full piece.
What to watch next: the gap between announced and demonstrated capacity at each listed site, which will show up in quarterly production and sales releases; the EV demand outlook each OEM publishes with its full-year results, since several have already slowed ramp schedules; and the state-level policy decisions on incentives that determined where several of these plants sit in the first place. Any of those three could reorder a "largest" list within a single model year.
via Google News: EV manufacturing (Source)
More from Daniel Okafor
Show full bio
Senior reporter covering marketplaces and e-commerce at Autoplant Brief.
111 articles